Visitors Overview
The visitors tab gives you insight into your visitor engagement, and helps you answer the following questions:
- Who are your most engaged visitors across all content tracks?
- Which content assets are specific visitors most interested in?
- What topics are trending for your most engaged visitors?
Path Analytics Filters
|
Note
|
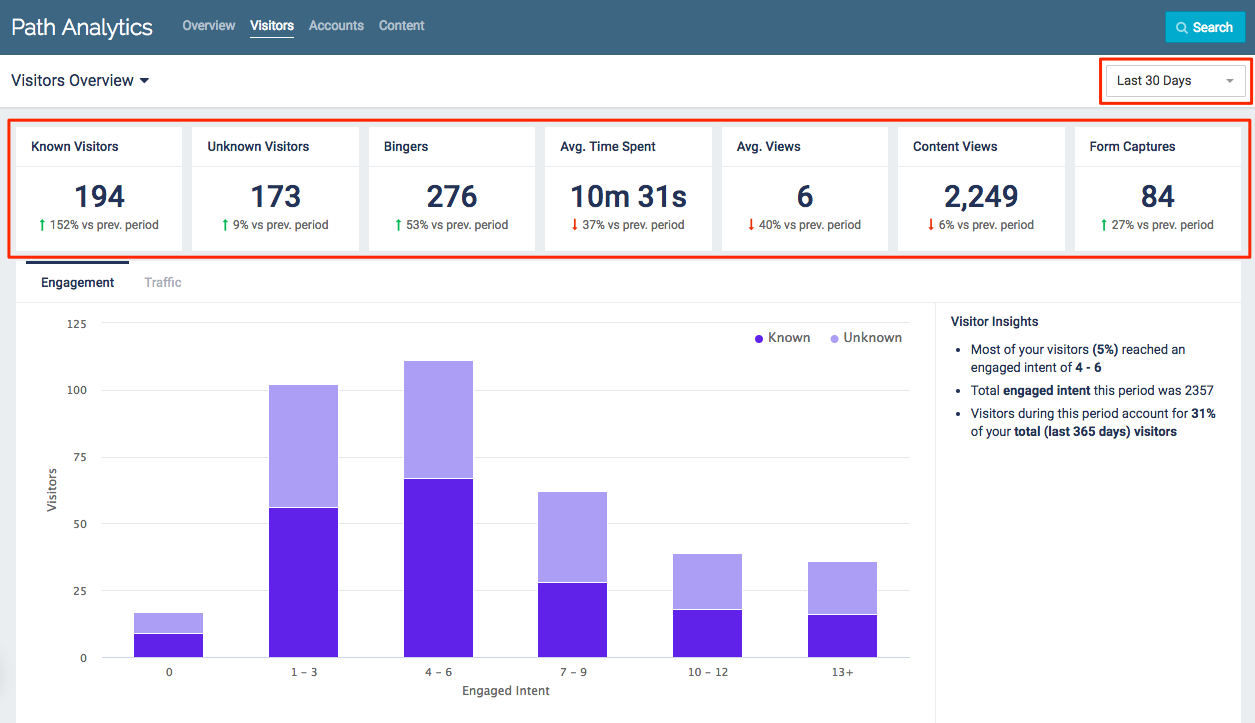
Use the drop-down menu in the top right corner to select a time frame. All data displayed will be from the selected period of time (7, 30, 60, 90, or 365 days). |
Known Visitors: Total number of identified visitors who visited any of your Content Tracks. Visitors become identified/known when they have an email address associated with their engagement data.
Unknown Visitors: Total number of unidentified visitors who visited any of your Content Tracks. These are visitors who do not have an email address associated with their engagement data.
Bingers: Total number of visitors who consumed two or more content assets during any single session. Both known and unknown visitors can be bingers.
Avg. Time Spent: Average amount of time visitors spent viewing content. This is calculated by dividing the total amount of time visitors spent viewing content tracks by the total number of visitors.
Avg. Views: Average number of page views per visitor. This is calculated by dividing the total number of page views by the total number of visitors.
Content Views: Total number of page views from all content assets across all Content Tracks.
Form Captures: Total number of forms submitted in content tracks. This includes any submitted Standard PathFactory forms as well as any External URL or Custom HTML forms which are tracked by Capture Tags.
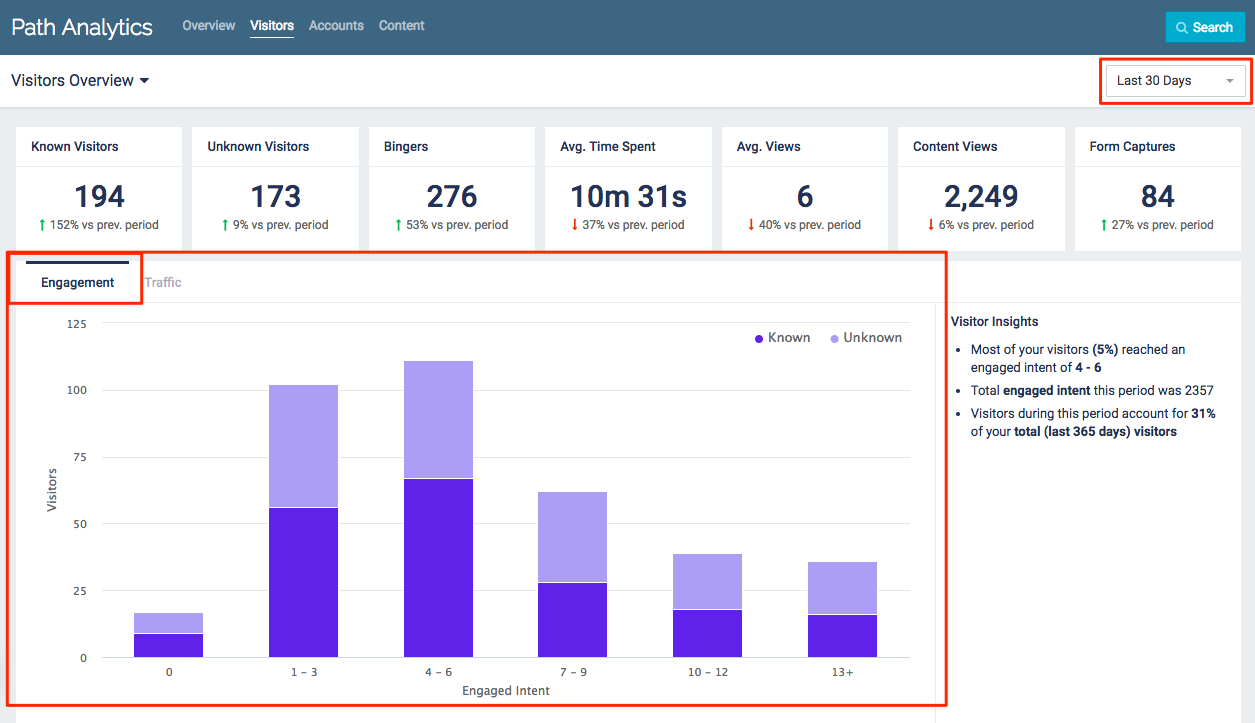
Engagement Chart
This chart displays the number of known and unknown visitors according to the Engaged Intent score they earned during the specified time frame.
Selecting a Time Frame
- Use the drop-down menu in the top right corner to select a time frame. All data displayed will be from the selected period of time (7, 30, 60, 90, or 365 days).
Traffic Chart
This chart displays the number of known and unknown visitors who visited your content tracks during the selected time frame.
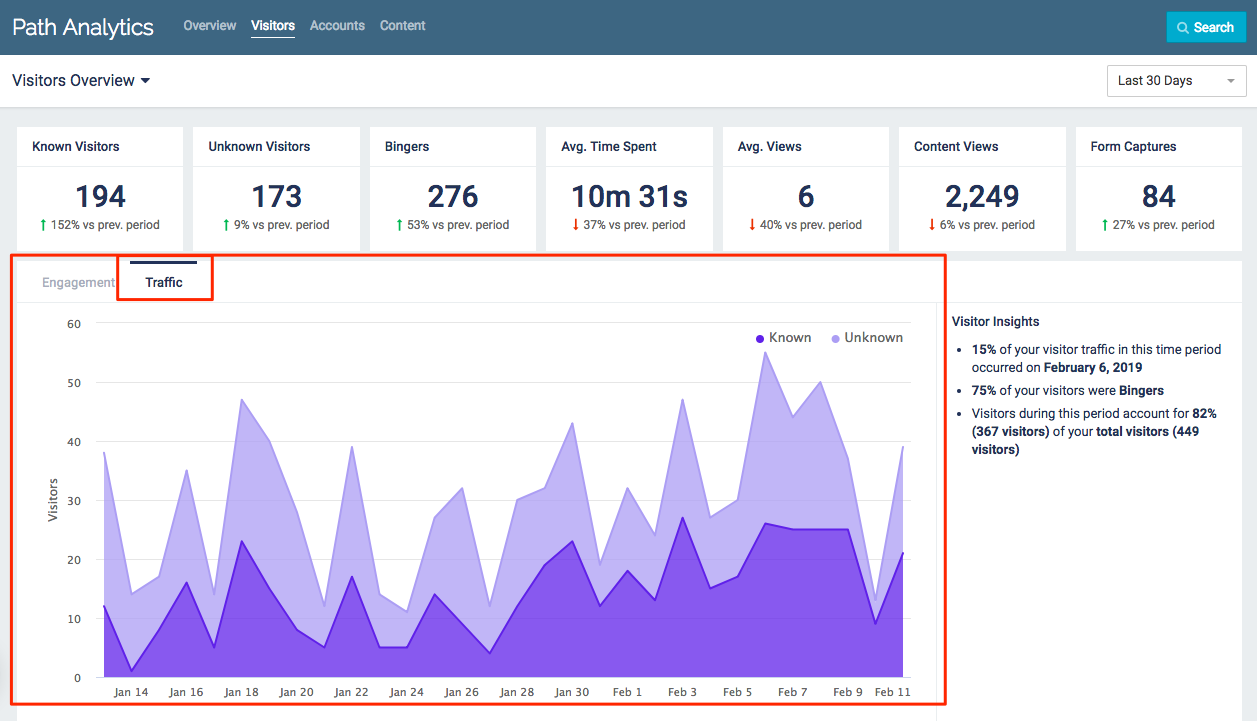
Traffic Chart Example
- Use the drop-down menu in the top right corner to select a time frame. All data displayed will be from the selected period of time (7, 30, 60, 90, or 365 days).
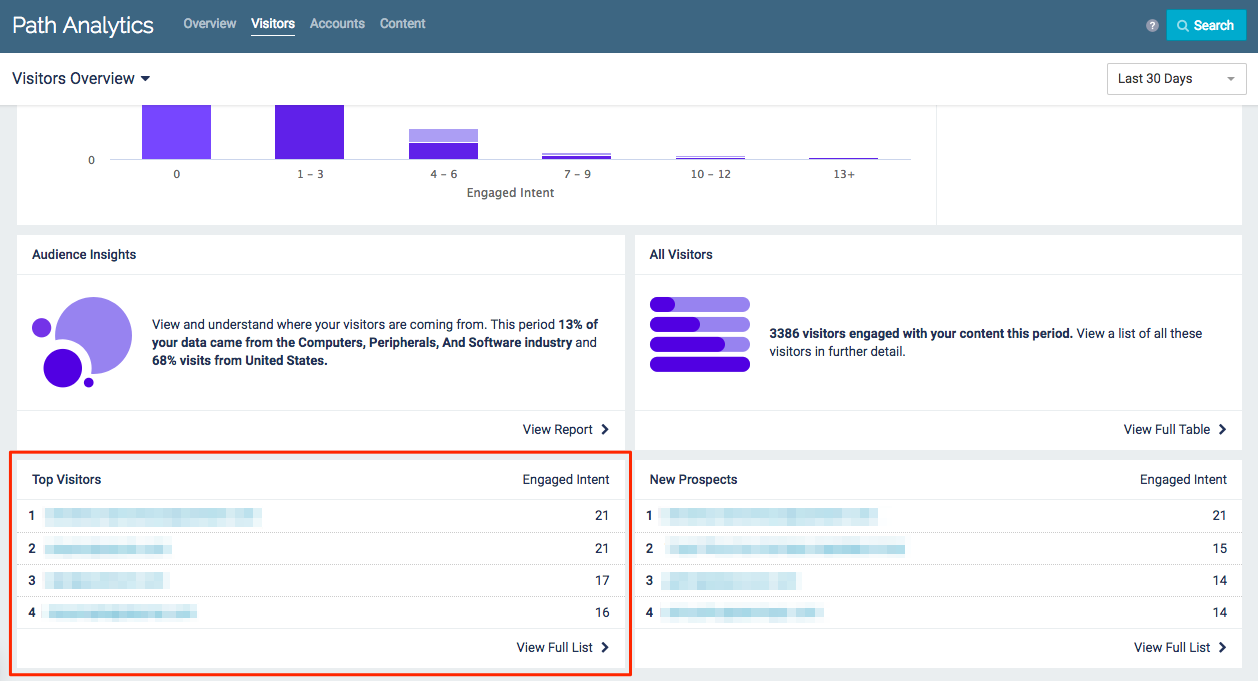
Top Visitors
Your top 4 visitors from the selected time frame are listed here, ranked by Engaged Intent.
- Click through to see more of your Top Visitors
- Click on any visitor to access more detailed data on that specific visitor
 Example of Top Visitor analytics
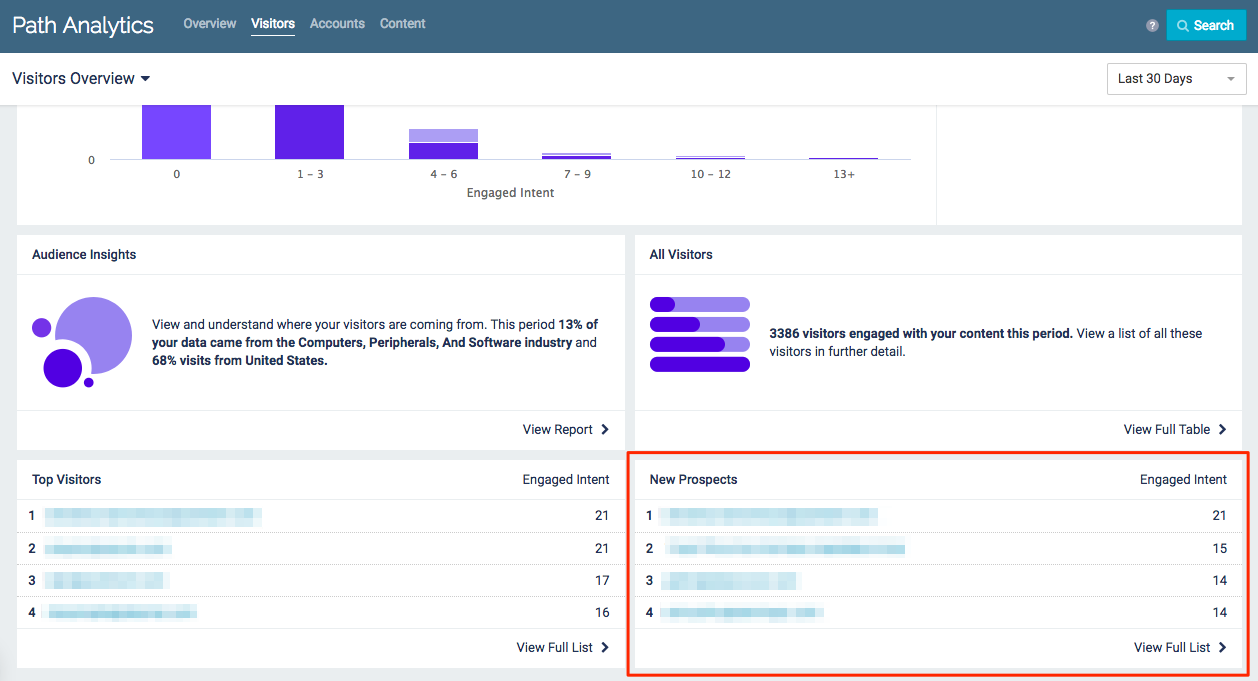
New Prospects
Your top 4 new prospects from the selected time frame are listed here. These are visitors who viewed your content for the first time during the selected time frame, ranked by Engaged Intent.
- Click through to see more of your top New Prospects
- Click on any visitor to access more detailed data on that specific visitor
 Example of Visitors Overview analytics
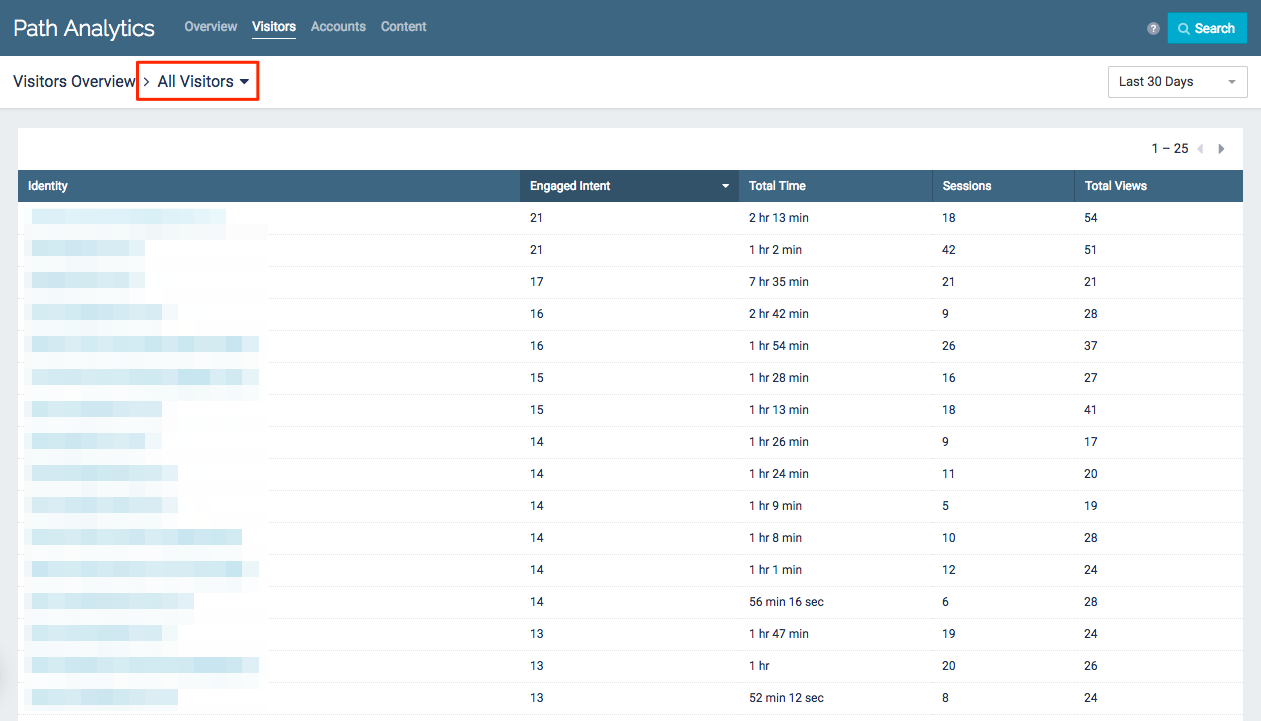
All Visitors
The All Visitors table provides a list of all known and unknown visitors who have viewed your content within the selected time frame.
 All Visitors list
- Click on the column headings to sort by Engaged Intent, Total Time, Sessions, or Total Views
- Click on any visitor to access more detailed data on that specific visitor
- Use the drop-down menu in the top right corner to select a time frame. All data displayed will be from the selected period of time (7, 30, 60, 90, or 365 days).
Identity: The unique identifier of the visitor. Known visitors are identified by their email address, and unknown visitors are given a unique alphanumeric ID.
Engaged Intent: The total engagement score earned by the visitor while viewing your content during the selected time frame.
|
Note
|
For more information on how Engaged Intent is defined, see the glossary. |
Total Time: Total amount of time the visitor spent viewing your content assets.
Sessions: Total number of sessions the visitor had with your Content Tracks.
|
Note
|
For more information on sessions, see the glossary. |
Total Views: Total number of pageviews by the visitor during the selected time frame.
Specific Visitors
Select a known or unknown visitor from anywhere in Path Analytics to get deeper insights into how that particular person engaged with your content.
|
Note
|
Know who you’re looking for? Use the search bar to quickly find a specific visitor! |
Visitor Activity Example
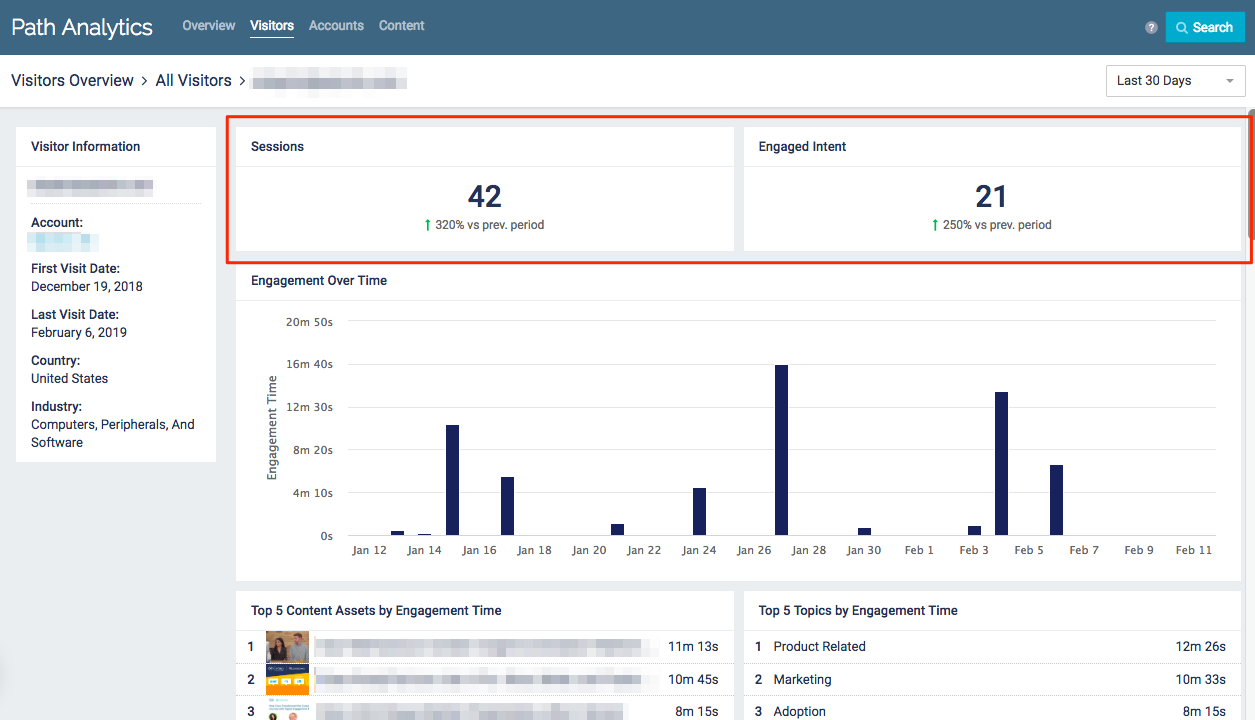
Sessions: Total number of sessions the visitor had with your Content Tracks during the selected time frame.
|
Note
|
For more information on sessions, see the glossary. |
Engaged Intent: The total engagement score earned by the visitor while viewing your content during the selected time frame.
|
Note
|
For more information on how Engaged Intent is defined, see the glossary. |
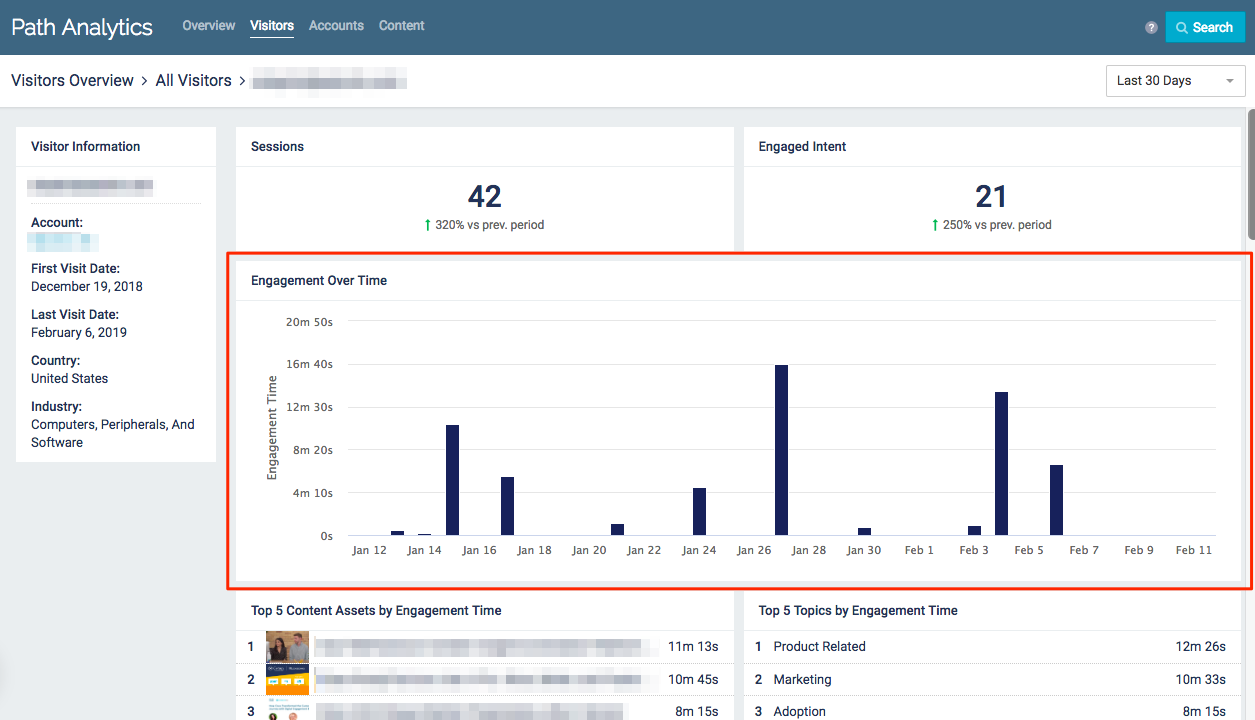
Engagement Over Time
This chart shows you which days the visitor was viewing your content.
Visitor Engagement Example
- Hover over the bars for more information on a specific day’s engagement
- Total Time: Total amount of time the visitor spent viewing your Content Tracks on a specific day
- Sessions: Total number of sessions the visitor had with your Content Tracks on a specific day
- Content Tracks: Total number of Content Tracks the visitor viewed on a specific day
Top 5
View lists of what the visitor is most engaged with.
- Top 5 content assets the visitor viewed during the selected time frame
- Top 5 topics the visitor engaged with during the selected time frame
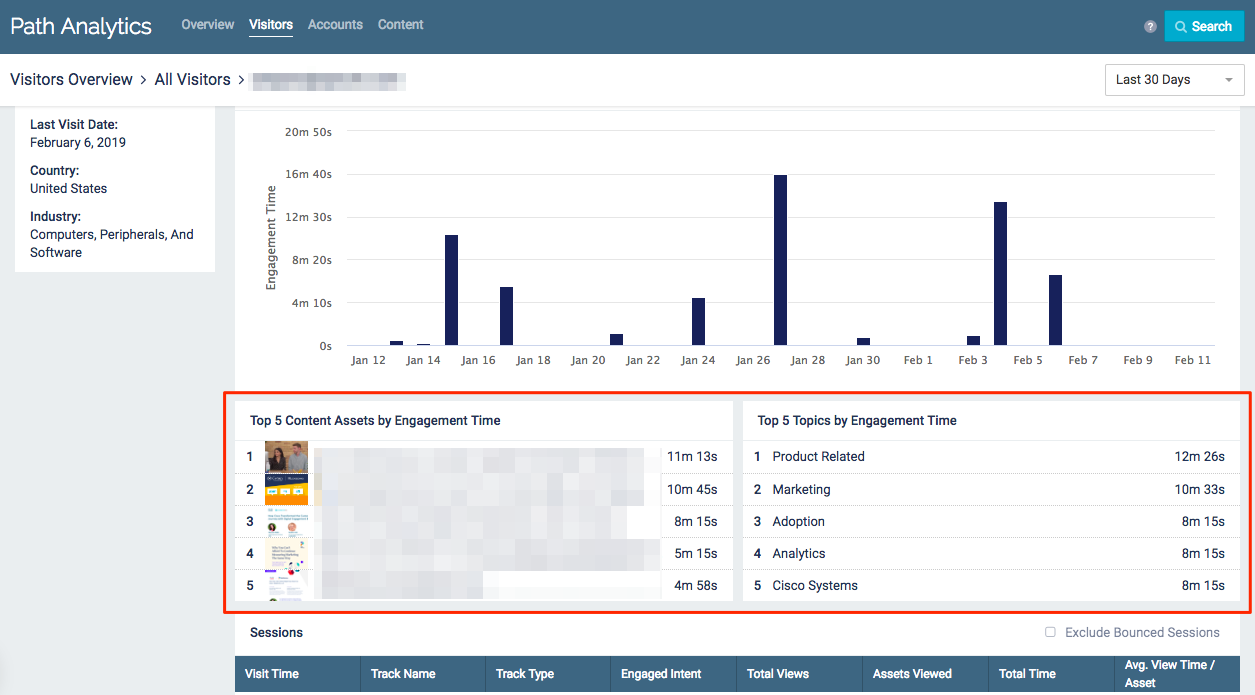
Visitor Engagement Example
Visitor Session Table
This table lists every session the visitor had with your Content Tracks within the selected time frame.
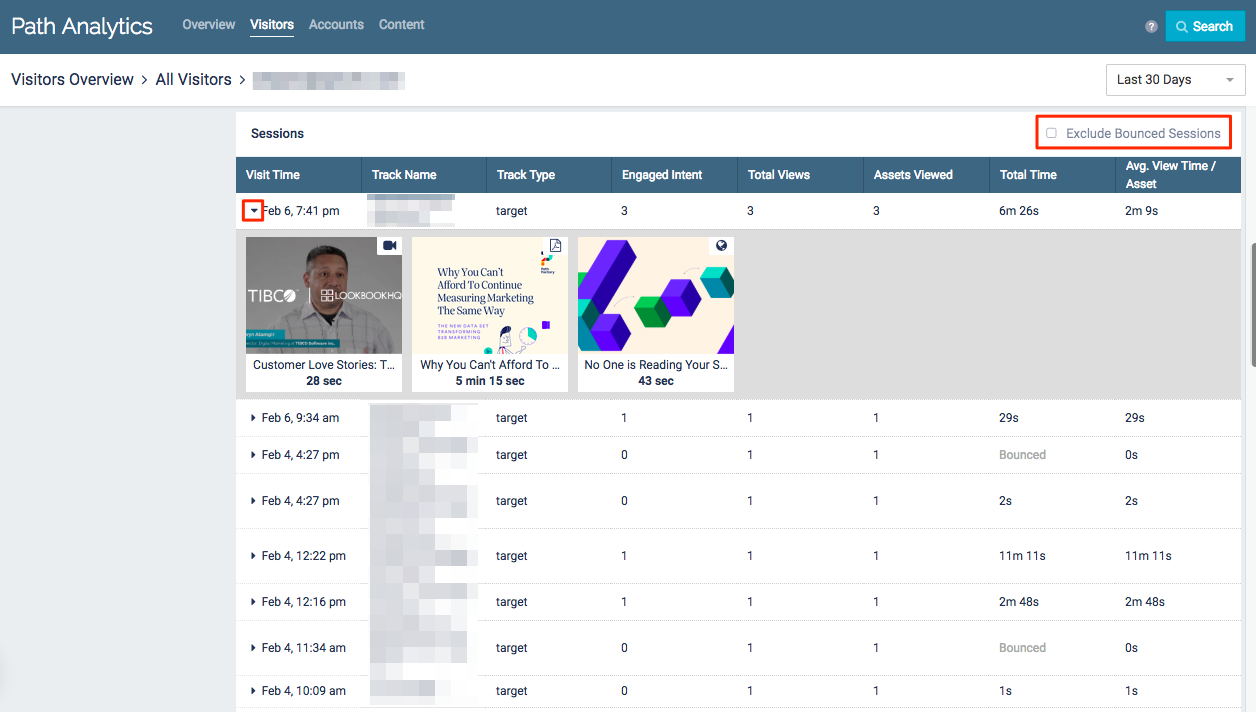
Visitor Sessions
|
Note
|
Click the triangle next to the Visit Time to see which content assets the visitor viewed during the session. The content assets are listed in the order they were viewed, with the time spent on each content asset listed beneath. |
Visit Time: Date and time stamp from the beginning of the visitor session.
Track Name: Name of the Content Track the visitor viewed.
Track Type: Specifies whether the session was with a Target or Recommend Content Track.
Engaged Intent: The engagement score earned by the visitor from engaging with content during the session.
Total Views: Total number of page views within a Content Track during the session.
Assets Viewed: Total number of content assets the visitor viewed in a Content Track during the session.
Total Time: Total amount of time the visitor spent in a Content Track during the session.
|
Note
|
If this column lists “Bounced” it means that the visitor spent 0 seconds in a Content Track during the session. This can happen if a visitor quickly opens and closes the Content Track, or if they pass by the tab in their web browser. You can filter out these sessions by selecting Exclude Bounced Sessions at the top right of the table. |
Avg. View Time/Asset: Average time the visitor spent viewing a content asset. This is calculated by dividing the Total Time by the Assets Viewed.
Top Visitors
The Top Visitors table provides a list of the top 20 visitors according to their Engaged Intent.
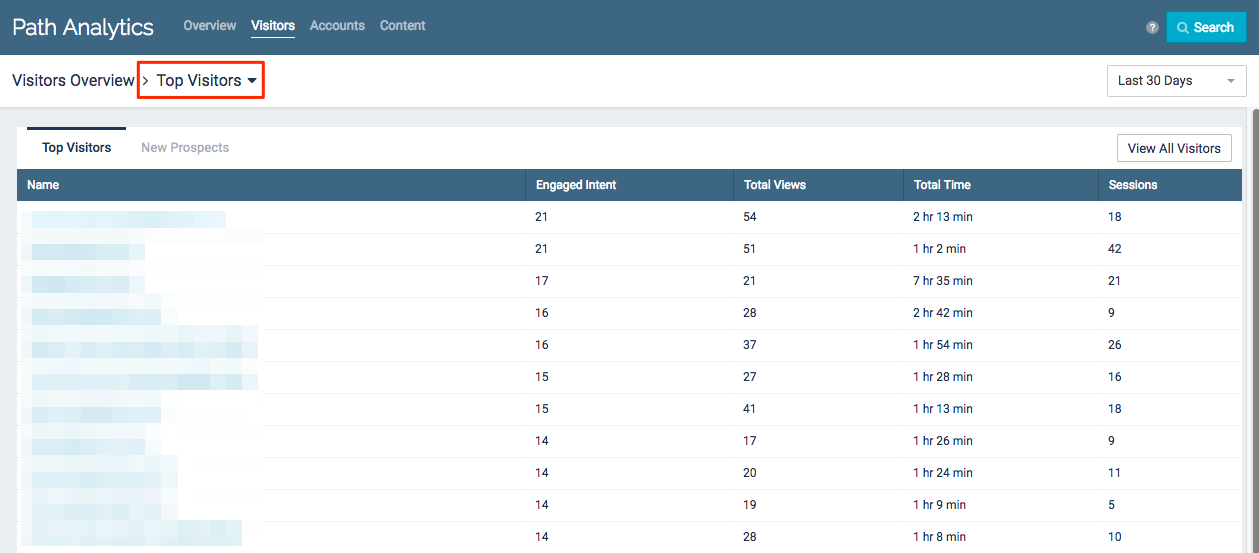
Top Visitors Example
- This table is not sortable by column headings, but you can click View All Visitors in the top right corner to view the full table of visitors. The All Visitors table is sortable by column headings.
- Click on any visitor to access more detailed data on that specific visitor
- Use the drop-down menu in the top right corner to select a time frame. All data displayed will be from the selected period of time (7, 30, 60, 90, or 365 days).
Name: The unique identifier of the visitor. Known visitors are identified by their email address, and unknown visitors are given a unique alphanumeric ID.
Engaged Intent: The total engagement score earned by the visitor while viewing your content during the selected time frame.
|
Note
|
For more information on how Engaged Intent is defined, see the glossary. |
Total Views: Total number of pageviews by the visitor during the selected time frame.
Total Time: Total amount of time the visitor spent viewing your content assets.
Sessions: Total number of sessions the visitor had with your Content Tracks.
|
Note
|
For more information on sessions, see the glossary. |
New Prospects
The New Prospects table provides a list of the top 20 new prospects according to their Engaged Intent.
A new prospect is any known or unknown visitor who viewed a content track for the first time during the selected time frame.
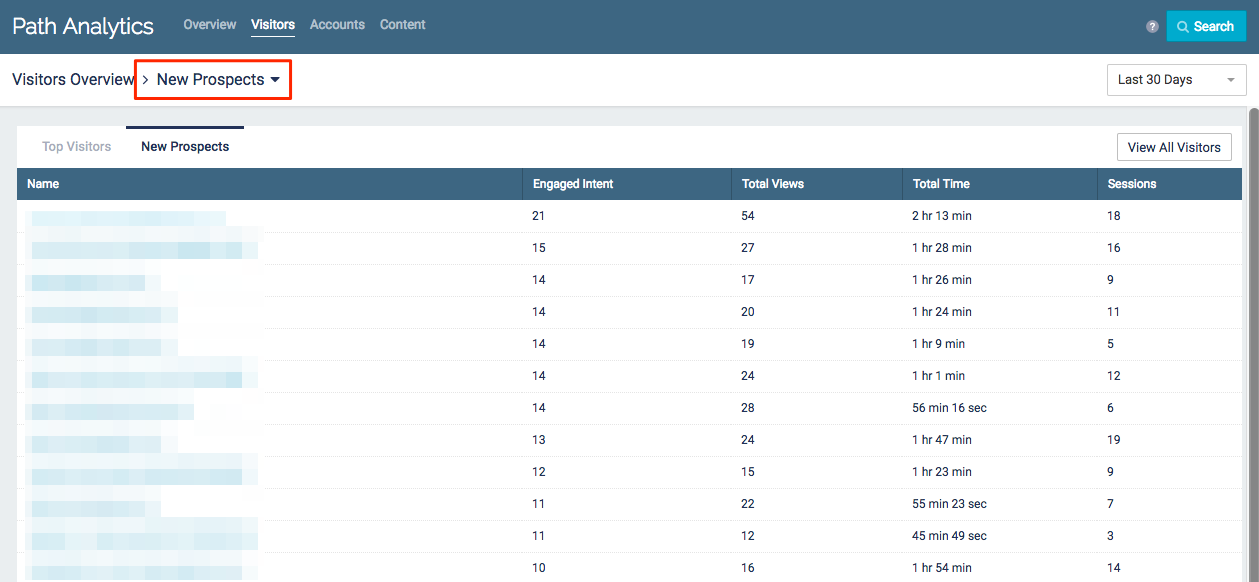
New Prospects Table
- This table is not sortable by column headings, but you can click View All Visitors in the top right corner to view the full table of visitors. The All Visitors table is sortable by column headings.
- Click on any visitor to access more detailed data on that specific visitor
- Use the drop-down menu in the top right corner to select a time frame. All data displayed will be from the selected period of time (7, 30, 60, 90, or 365 days).
Name: The unique identifier of the visitor. Known visitors are identified by their email address, and unknown visitors are given a unique alphanumeric ID.
Engaged Intent: The total engagement score earned by the visitor while viewing your content during the selected time frame.
|
Note
|
For more information on how Engaged Intent is defined, see the glossary. |
Total Views: Total number of pageviews by the visitor during the selected time frame.
Total Time: Total amount of time the visitor spent viewing your content assets.
Sessions: Total number of sessions the visitor had with your Content Tracks.
|
Note
|
For more information on sessions, see the glossary. |
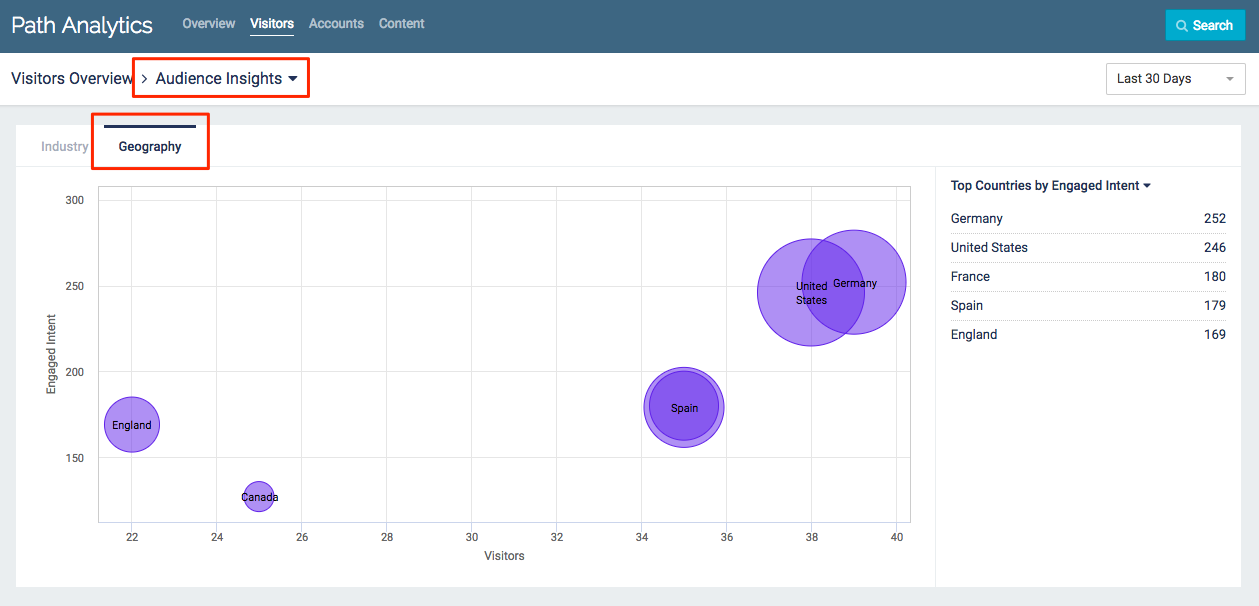
Audience Insights
There are 2 bubble charts available under Audience Insights: Industry and Geography.
Audience by Industry
This chart displays the industries which engaged the most with your content during the selected time frame.
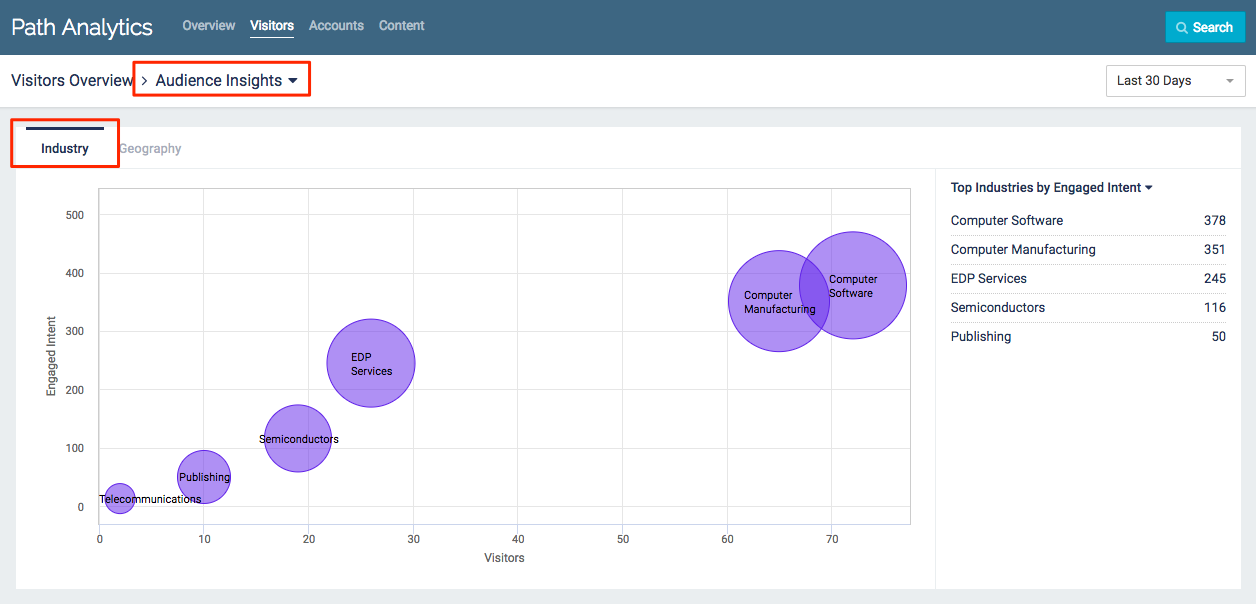
Audience by Industry Example
|
Note
|
Only known and unknown visitors who have an industry associated with them will be included in this chart. |
- Hover over a bubble for more information about the industry
- Visitors: The total number of visitors who have been identified as belonging to the industry
- Engaged Intent: Total engagement score earned by all visitors from the industry while engaging with content during their sessions
- Content Views: Total number of content assets which were viewed by visitors from the industry
- Industry: The industry’s name. Industry names are from NAICS (North American Industry Classification System).
Audience by Geography
This chart displays the countries which engaged the most with your content during the selected time frame.
Audience by Geography Example
- Hover over a bubble for more information about the country
- Visitors: The total number of visitors from the specific country
- Engaged Intent: Total engagement score earned by all visitors from the country while engaging with content during their sessions
- Content Views: Total number of content assets which were viewed by visitors from the country
- Country: Name of the country
|
Note
|
Country is determined by the visitors’ IP address. |